
Kenya Agri AtlasData on food systems
Live
Tracked income KSh 774B 2023/24·Maize 38M 90-kg bags·Tea exports $1.4B·Milk 5.2B litres·Smallholders 7.5M

Part I · Observed evidence

The current state of selected crop value chains in Kenya

The data describe markedly different crop economies. Some value chains are expanding through additional cultivated area, others are changing mainly through yield and productivity, and several market-facing crops are shaped as much by imports or exports as by domestic output.

Across the ten crops, three broad patterns stand out. Sunflower and avocado show substantial recent expansion, although sunflower growth has been driven mainly by cultivated area while avocado has combined area growth with higher measured yield. Coffee and canola have changed within comparatively stable land footprints, while tea’s export performance has strengthened despite year-to-year variation in production. Palm oil remains a large import market, and cotton and cashew continue to show pronounced variation in output and productivity.

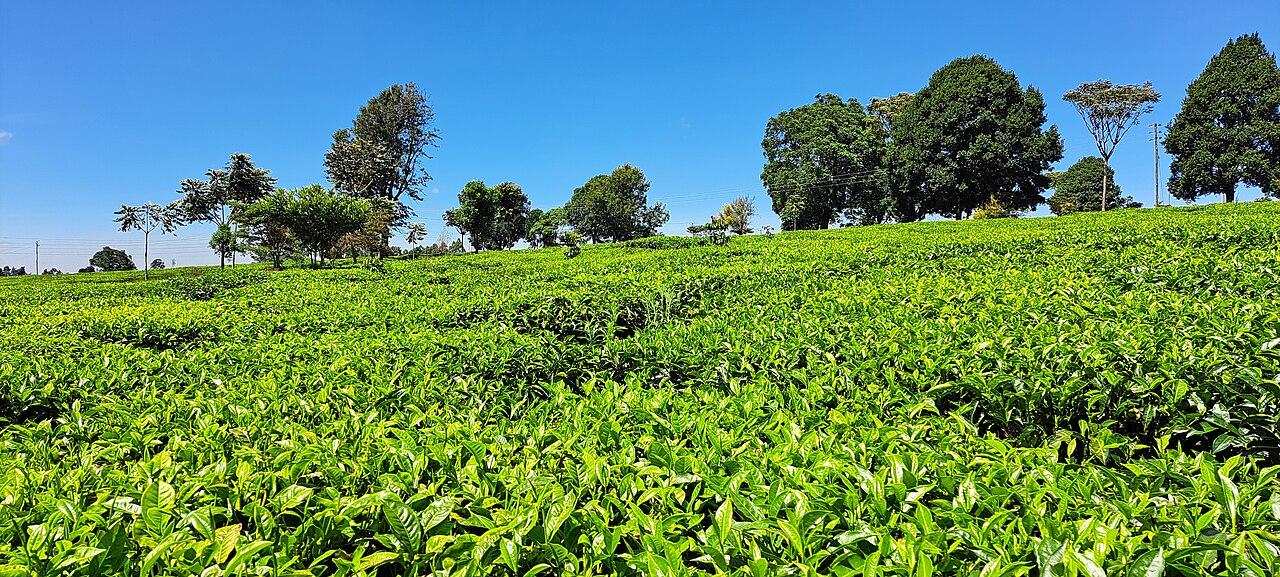
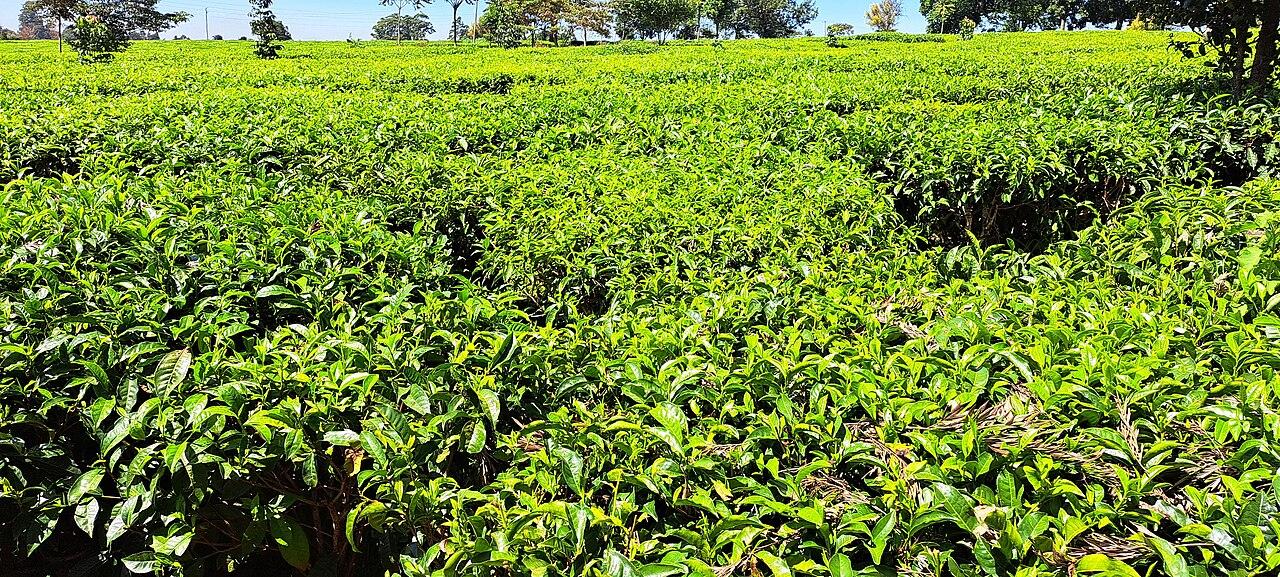
Tea fields in Kenya
Tea growing in Kenya. SeanTwice / Wikimedia Commons · CC0.
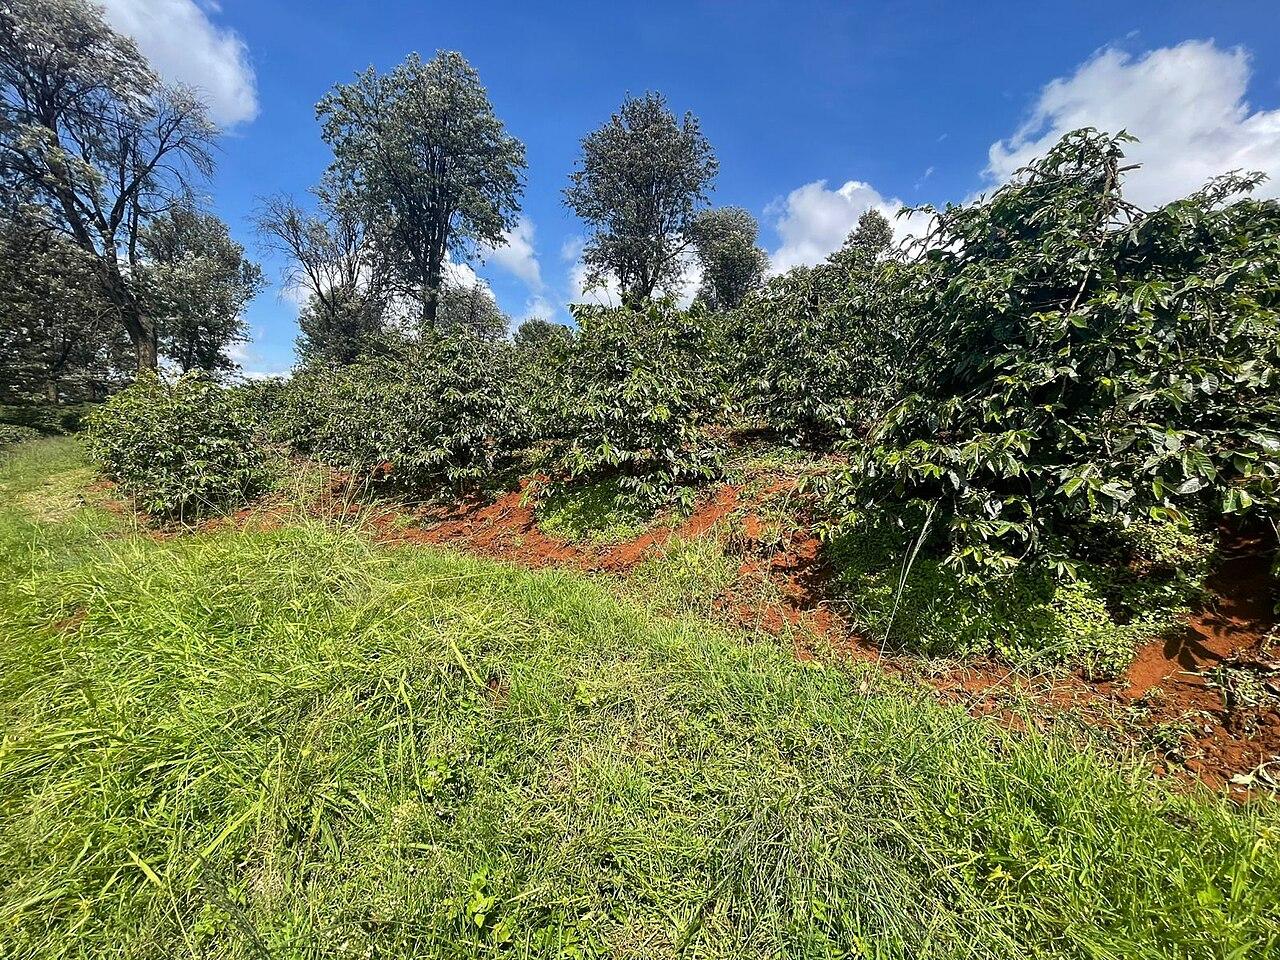
Coffee plantation in Cianda, Kiambu County
Coffee plantation in Cianda, Kiambu County. Lebu Ayiga / Wikimedia Commons · CC BY 4.0.
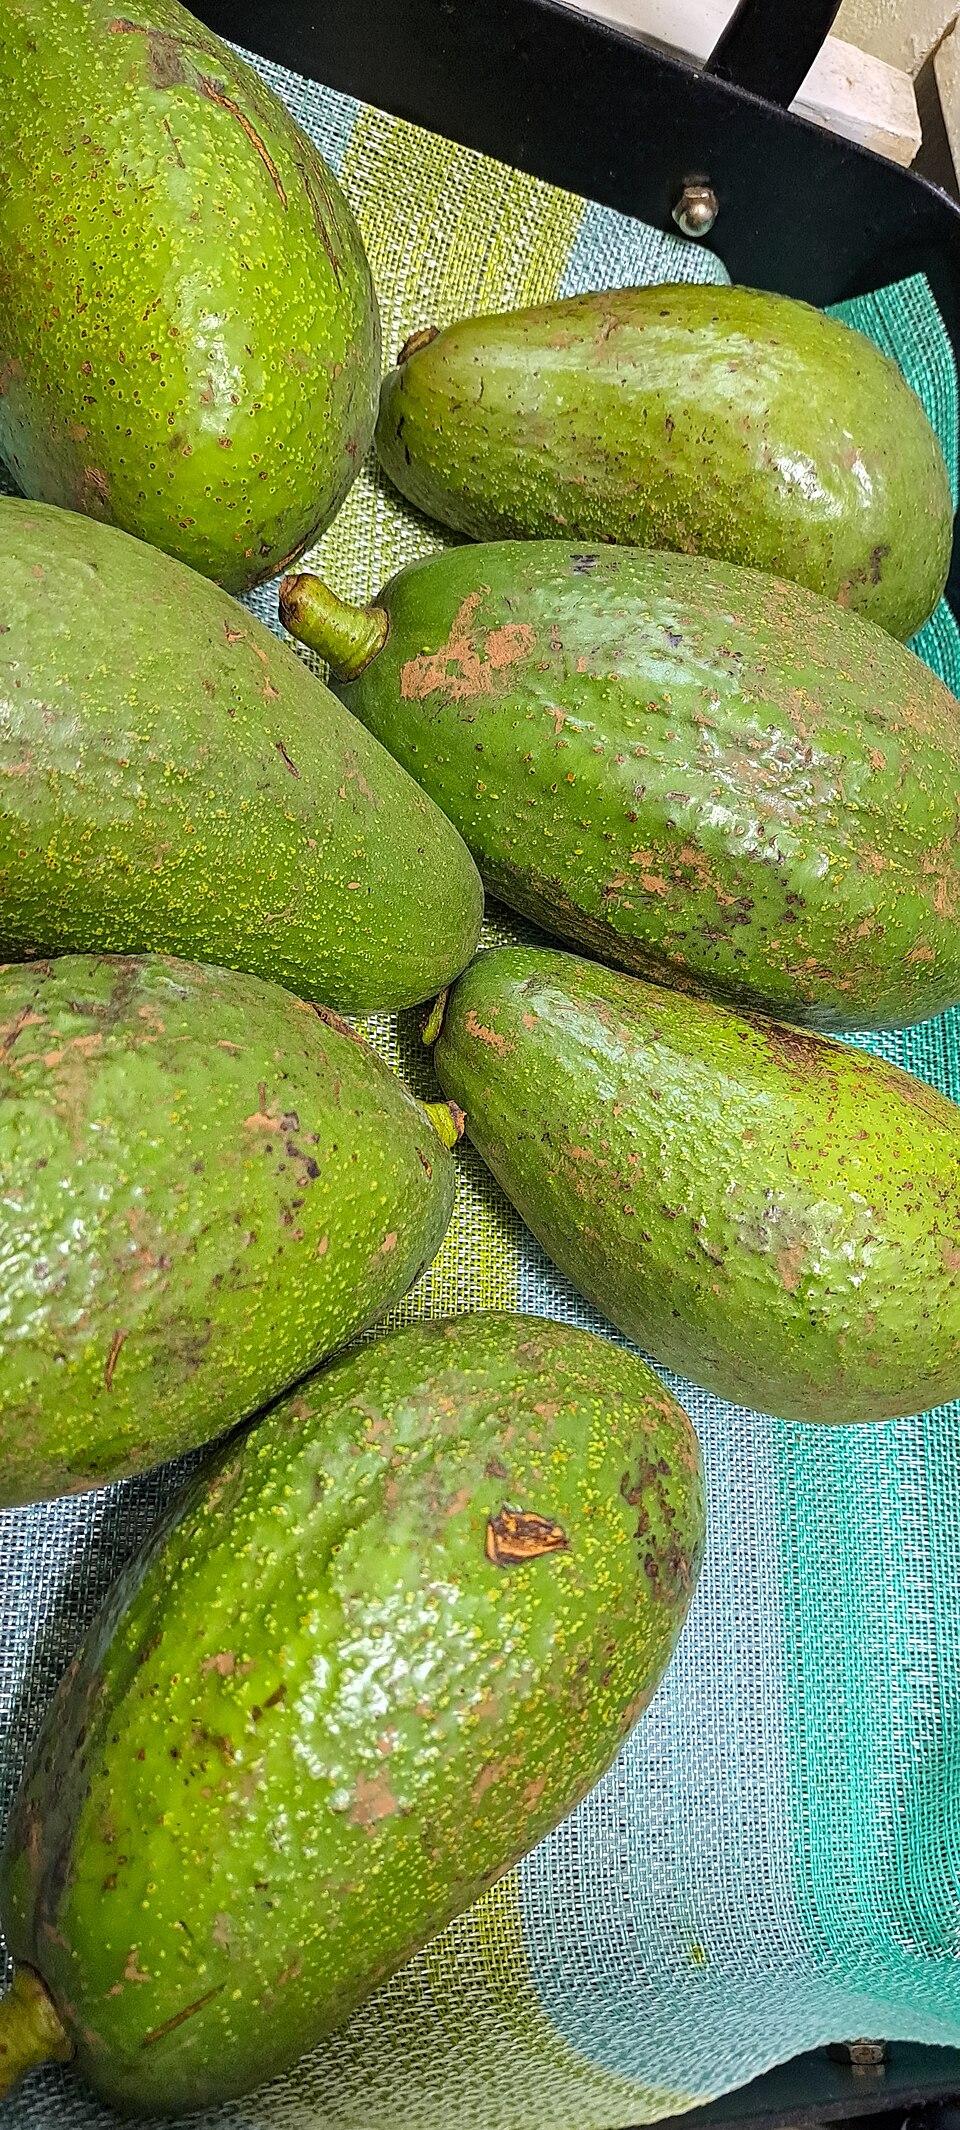
Avocados grown in Kenya
Avocado grown in Kenya. SeanTwice / Wikimedia Commons · CC0.

Spatial view

Where is production concentrated?

Reported crop production in each of Kenya’s 47 counties. Counties without a reported value stay grey; they are not treated as zero.

Sunflower seed production

2024 · reported county production · tonnes

Loading county map…

Reported production (tonnes)

  1. 0–275
  2. 275–1.1k
  3. 1.1k–2.5k
  4. 2.5k–4.4k
  5. 4.4k–6.9k
  • No reported value

Source: KNBS, National Agriculture Production Report 2025; source table: AFA. County sunflower production, 2024.

Observed series

Edible oils and oilseeds

The oilseed value chains follow markedly different trajectories. Sunflower expanded rapidly after 2022, canola remained comparatively stable, soybean-oil imports declined between 2023 and 2024, and palm oil continued to operate at a much larger import scale.

Sunflower

Sunflower production expanded sharply after 2022, while oil imports remained volatile.

Between 2022 and 2024, sunflower changed scale rapidly. Cultivated area increased from 2,046 hectares to 40,675 hectares, while seed production rose from 483 tonnes to 41,288 tonnes. Measured yield increased from 0.24 tonnes per hectare in 2022 to 1.42 tonnes in 2023 before settling at 1.02 tonnes in 2024. The increase in output was therefore driven principally by the expansion of cultivated area, alongside a recovery from the exceptionally low 2022 yield.

Direct sunflower-oil imports followed a different path. Imports were 6,703 tonnes in 2020, rose to 12,742 tonnes in 2022 and stood at 8,949 tonnes in 2024. The combination of rapid domestic production growth and a variable import market points to a value chain in which production capacity and market absorption need to be assessed separately.

Data note. The 2024 production increase was driven mainly by a much larger cultivated area; measured yield was below its 2023 level.

Sunflower seed productionMT seed
010k20k30k40k50k20222023202441.3k
  • Sunflower seed production

Source: Agriculture and Food Authority (AFA) statistical series recorded in the workbook.

Canola

Canola production has been comparatively stable, while direct oil imports have declined from their 2019 level.

Canola has operated within a relatively narrow domestic production range over the observed period. Cultivated area remained between approximately 3,991 and 4,509 hectares from 2019 to 2024, and seed production remained between about 12,956 and 14,603 tonnes. Yield also varied within a limited band, from 3.24 to 3.50 tonnes per hectare.

The market series moved differently. Direct canola and rapeseed-oil imports declined from 4,936 tonnes in 2019 to 2,290 tonnes in 2024, although the decline was not continuous and imports recovered to 3,081 tonnes in 2023. The observed record therefore indicates a stable domestic production base alongside a smaller, but variable, direct import market.

Data note. Domestic production remained relatively stable while direct canola/rapeseed-oil imports ended 2024 well below their 2019 level.

Canola seed productionMT seed
04k8k12k16k20k20192020202120222023202414.4k
  • Canola seed production

Source: Agriculture and Food Authority (AFA) statistical series recorded in the workbook.
Soybean

The 2026 AFA yearbook reports a step-change in 2025 soybean area and output that requires reconciliation.

AFA Yearbook of Statistics 2026 Table 69 reports 375,911 hectares under soybean in 2025, production of 455,321.61 tonnes and a yield of 1.21 tonnes per hectare, with an average farm-gate price of KES 71.38/kg and reported production value of KES 32.5 billion.

Those levels are far above the prior observed soybean series used in this report. The point is therefore shown as an official 2025 observation but is flagged as a series break; consistent with the PE methodology, it should pass through base-year reconciliation before it changes the forecast baseline.

Data note. The 2025 yearbook point is official evidence, but the discontinuity versus the preceding series is large enough that it should be reconciled before model calibration.

Soybean seed productionMT seed
0100k200k300k400k500k20232025455k
  • Soybean seed production

The supplied AFA Yearbook of Statistics 2026 page reports a much larger 2025 soybean area and production level than the prior series. It is displayed as an official observation but flagged for reconciliation before it is used to re-base the forecast.

Source: AFA Yearbook of Statistics 2026 (Table 69 supplied page) plus AFA 2024 trade statistics.

Palm Oil

Palm oil remains a large import market, with demand measured at close to 0.8 million tonnes.

The 2024 market anchor is 793,539 tonnes of palm-oil products, expressed on a crude-palm-oil-equivalent basis. The figure illustrates the scale of Kenya’s palm-oil requirement relative to the other edible-oil crops examined in this report.

Crude palm oil imports were 775,688 tonnes in 2021, declined to 701,475 tonnes in 2022 and recovered to 784,636 tonnes in 2023. Although the 2024 AFA measure has a broader product scope, both measures place Kenya’s palm-oil market at roughly eight hundred thousand tonnes and show the continuing importance of imports.

Data note. The 2021–2023 customs measure covers crude palm oil, while the 2024 AFA figure covers a broader set of palm-oil products; both indicate a market of similar overall scale.

Palm-oil-products import demandMT crude-palm-oil equivalent (left) · KES million (right)
00200k40k400k80k600k120k800k160k1M200k2021202220232024794k109k
  • Palm-oil-products import demand
  • Import value
  • Crude palm oil imports (different scope)

Import value reported by AFA for the same product scope as the displayed volume.

Source: Agriculture and Food Authority (AFA) and customs-series observations recorded in the workbook.

Observed series

Established export crops

Coffee and tea both show stronger market-facing indicators in recent years, but through different combinations of output, exports and productivity. Coffee has improved within a broadly stable cultivated area, while tea exports have risen more strongly than annual production.

Coffee

Coffee output and exports have recovered without a corresponding expansion in cultivated area.

Coffee cultivated area was 115,570 hectares in 2018 and 113,900 hectares in 2025, with a temporary decline to 108,199 hectares in 2021. Over the same period, production increased from 41,375 tonnes to 51,400 tonnes after falling to 34,512 tonnes in 2021. The change in output therefore occurred without a substantial expansion in cultivated area.

Exports followed a similar recovery in the later years, rising from 41,797 tonnes in 2021 to 53,376 tonnes in 2025. Measured yield increased from 0.36 tonnes per hectare in 2018 to 0.45 tonnes in 2025. Taken together, the series indicates that the recent recovery has occurred primarily within an established land footprint rather than through a large increase in area.

Data note. The recent recovery in coffee output has occurred within a cultivated area that is broadly similar to its 2018 level.

Coffee exportsMT clean/green coffee
020k40k60k80k100k2017/182018/192019/202020/212021/222022/232023/24202553.4k
  • Coffee exports

Source: Agriculture and Food Authority (AFA) and Kenya National Bureau of Statistics (KNBS) series recorded in the workbook.

Tea

Tea exports reached a new high in the observed series even as annual production remained variable.

Tea exports increased from 518,920 tonnes in 2020 to 653,736 tonnes in 2025. The series includes a pronounced decline to 450,330 tonnes in 2022, followed by three consecutive increases. The latest export observation is therefore substantially above both the 2020 level and the 2022 trough.

Production did not follow the same path. Made-tea output ranged from 535,040 tonnes in 2022 to 598,478 tonnes in 2024 and stood at 550,400 tonnes in 2025. Exports nevertheless reached 653,736 tonnes in 2025, showing that annual export volumes and production do not move one-for-one and should be interpreted as related but distinct measures.

Data note. The strongest recent movement is in exports, which rose for three consecutive years after the 2022 decline.

Tea exportsMT made tea
0200k400k600k800k1M202020212022202320242025654k
  • Tea exports

Source: Tea Board of Kenya and Kenya National Bureau of Statistics (KNBS) series recorded in the workbook.

Observed series

Fruit and tree-nut value chains

Avocado has recorded strong growth in both cultivated area and measured yield, while macadamia growth has been more closely associated with expansion of the planted footprint. Cashew presents a different pattern, with relatively stable area but weaker output and yield in the most recent observation.

Avocado

Fresh-avocado exports reached 129,706 tonnes in 2024; 2025 actual shipments were revised to 121,000 tonnes.

The Market tab uses measured fresh-avocado exports rather than total production as the market indicator. WITS records 95,036 tonnes in 2021, 103,240 tonnes in 2022, 122,581 tonnes in 2023 and 129,706 tonnes in 2024.

USDA FAS Nairobi revised 2025 to actual shipments of 121,000 tonnes valued at USD 159.1 million. Production, area and yield remain separate supply indicators rather than being conflated with the export market.

Data note. Export volume and value are shown on separate axes. The legacy forecast proxy is kept separate from the observed Market tab so the forecast series is not silently redefined.

Fresh avocado exportsMT fresh avocados (left) · USD million (right)
0040k4080k80120k120160k160200k20020212022202320242025121k159.1
  • Fresh avocado exports
  • Export value

WITS/UN Comtrade for 2021–2024; USDA FAS Nairobi revision to actual 2025 shipments/value for 2025.

Source: WITS/UN Comtrade (2021–2024) and USDA FAS Nairobi report KE2026-0007 (2025).

Macadamia

Macadamia export product weight more than doubled in 2024 as in-shell exports surged.

AFA reports 2023 exports of 7,800.3 tonnes of shelled macadamia and 1,876.8 tonnes in shell, worth KES 5.97 billion combined. In 2024 the combined exported product weight rose to 21,164.5 tonnes and value to KES 9.18 billion.

The Market tab shows those measured export quantities and values. Production, planted area and yield remain visible separately, while the old raw-nut-equivalent series is retained only inside the pre-existing forecast proxy.

Data note. Export product weight is not directly equivalent to raw-nut production; shelled and in-shell exports are therefore shown as actual product weights in the observed market view.

Macadamia exports (shelled + in-shell)MT product weight (left) · KES million (right)
0010k2k20k4k30k6k40k8k50k10k2023202421.2k9.2k
  • Macadamia exports (shelled + in-shell)
  • Export value

AFA National Agriculture Production Report 2025, Table 6.10; combined shelled and in-shell macadamia.

Source: AFA National Agriculture Production Report 2025, Table 6.10.

Cashew

Shelled-cashew exports held near 420 tonnes in 2024 while export value eased.

AFA reports shelled-cashew exports of 427.6 tonnes valued at KES 326.0 million in 2023 and 419.8 tonnes valued at KES 296.8 million in 2024.

These measured exports appear in the Market tab. Raw-cashew production remains in the Production tab so market activity and farm output are not treated as the same series.

Data note. The observed Market tab reports shelled exports, while the production series remains raw cashew nuts.

Shelled cashew exportsMT shelled cashew (left) · KES million (right)
0010010020020030030040040050050020232024419.8296.8
  • Shelled cashew exports
  • Export value

AFA National Agriculture Production Report 2025, Table 6.10.

Source: AFA National Agriculture Production Report 2025, Table 6.10.

Observed series

Cotton and textile inputs

Cotton is characterised by substantial year-to-year variation in cultivated area, output and yield. Output has recovered from the 2021 trough, while measured productivity remains variable, indicating that acreage shifts account for much of the recent change in production.

Cotton/Textile

Cotton output has recovered from the 2021 trough, but productivity remains volatile.

Cultivated cotton area varied substantially between 2018 and 2024, from 18,000 hectares in 2019 to 8,585 hectares in 2022 before rising to 16,469 hectares in 2024. Seed-cotton production followed a similarly uneven path, falling to 1,300 tonnes in 2021 and increasing to 6,234 tonnes in 2024, the highest value in the observed series.

Measured yield was 0.39 tonnes per hectare in 2018 and 0.38 tonnes in 2024, with annual values ranging from 0.12 to 0.44 tonnes per hectare. Because yield in 2024 was close to its 2018 level, the recent increase in output is associated more strongly with the recovery in cultivated area than with a sustained rise in productivity.

Data note. By 2024, both cultivated area and seed-cotton production had recovered strongly from their 2021–2022 lows, while yield remained within the range seen earlier in the period.

Seed cotton productionMT seed cotton
02k4k6k8k10k20182019202020212022202320246.2k
  • Seed cotton production

Source: Agriculture and Food Authority (AFA) and KALRO data incorporated in the workbook.

Minor oilseeds and oil-crop products

Trade volume and value, 2023–2024

The trade tables include many smaller oilseed and nut products that drop out when the analysis focuses on palm, sunflower and soybean. Each is shown here with physical volume on the left scale and trade value on the right.

Oil cake: importsTonnes (left) · KES million (right)
004k1008k20012k30016k40020k5002023202410.4k159.8
  • Volume
  • Value
2024 volume
10,415 t
2023: 8,750 t
2024 value
KES 159.81m
2023: KES 225.39m
YearVolume (t)Value (KES million)
20238,750225.39
202410,415159.81

Source: Agriculture and Food Authority, National Agriculture Production Report 2025 and AFA Yearbook trade tables, 2023–2024.

Part II · Modelling and prediction

From observed conditions to a 2035 outlook

For edible oils, the forecasting specification follows a recursive-dynamic partial-equilibrium (PE) architecture: reconcile the base-year supply–utilisation account, estimate demand and domestic supply separately, solve prices jointly, and treat imports as the residual requirement. Other value chains keep crop-specific market models where the edible-oil framework does not apply.

The observed evidence and the forecasts are kept deliberately separate. The 2026-yearbook soybean observation is shown as evidence and flagged for reconciliation rather than being allowed to create an automatic break in the forecast baseline. Low, Base and High paths are transparent sensitivity scenarios until the full econometric estimation, backcast and stochastic validation described in the methodology are complete. Planning envelopes and analyst-defined parameters are identified as assumptions, not presented as observed facts.

Sunflower farming in Kenya
Sunflower farming in Kenya. Yganyana / Wikimedia Commons · CC BY-SA 4.0.
Tea farm in Limuru, Kenya
Tea farm in Limuru. SeanTwice / Wikimedia Commons · CC0.
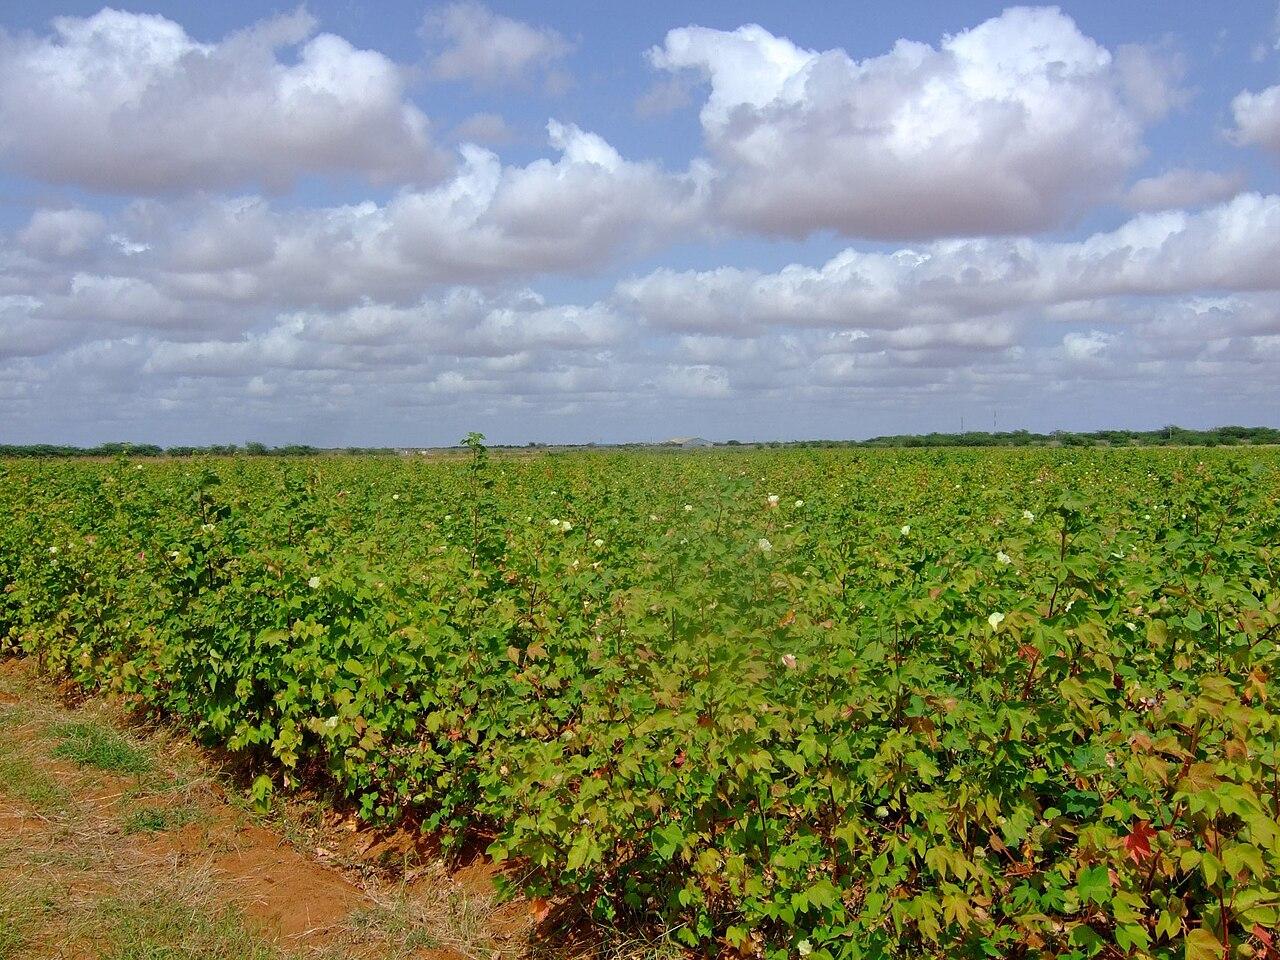
Cotton crop at Bura, Kenya
Cotton crop at Bura. Jerome KL / Wikimedia Commons · CC BY-SA 4.0.
Forecasting methodology

Recursive-dynamic partial equilibrium for edible oils

The six modules of the specification, and how far this report applies each one.

The edible-oils outlook is specified around a recursive-dynamic partial-equilibrium methodology rather than a single trend or growth rate. The market is treated as import-clearing: domestic supply, trade, stocks, re-exports and distinct food, processing and oleochemical uses are reconciled first, then imports are solved as the residual requirement.

Accounting discipline. The specification uses refined-oil-equivalent as the common unit, a 2025 base year and, where data allow, a centred 2024–2026 average for trade and stocks. The formal methodology reports 2030, 2035 and 2040 run years; this edition shows the 2035 horizon until the complete estimation dataset is assembled.

ModuleMethod for edible oilsHow this report applies it
0 · Base-year balanceReconcile domestic oil output + imports − exports − re-exports ± stocks with food-direct, food-processing, oleochemical and loss uses. Cross-entropy balancing is the specified reconciliation method.Observed trade and production series are kept separate and data breaks are flagged. The 2025 soybean observation from the 2026 yearbook is shown but is not used to re-base the forecast before reconciliation.
1 · DemandEstimate a censored QUAIDS demand system on KIHBS microdata; use a Gompertz saturation path for long-run food-direct consumption; project processing and oleochemical demand from sector output and technical input coefficients.The Low, Base and High demand paths are labelled as calibrated sensitivity scenarios. They are not presented as re-estimated QUAIDS or Gompertz coefficients, which need the microdata and supply-use inputs.
2 · Domestic supplyBuild oil output crop by crop and county by county from harvested area × yield × (1 − post-harvest loss) × oil content × extraction efficiency × (1 − refining loss). Area follows Nerlovian partial adjustment; yield combines autonomous trend with logistic technology adoption; crush and refining capacity can bind.The edible-oil calculator separates physical oil content, extraction efficiency, losses and adoption, and uses a partial-adjustment area path rather than a straight-line area and yield ramp.
3 · Deficit closureImports are the residual after domestic utilisation and supply are reconciled. The methodology then inverts substitution targets into area, yield and capacity requirements and can solve a least-cost expansion programme.For edible-oil calculator runs, a positive gap between demand and domestic supply is labelled as the residual import requirement, not as domestic demand.
4 · Prices and policyWorld-to-domestic price transmission is estimated with an asymmetric error-correction model; tariff, levy, exchange-rate and world-price scenarios feed both demand and supply incentives.Price and exchange-rate controls remain a sensitivity layer. Full error-correction estimation needs monthly price and trade-cost series this report does not yet hold.
5 · Validation and uncertaintyBackcast 2016–2025 and report MAPE and Theil’s U; then run at least 10,000 Monte Carlo draws and report P10/P50/P90 fan charts plus parameter influence.Read Low, Base and High as deterministic scenario envelopes, not probabilistic confidence intervals, until the backcast and Monte Carlo workflow is run.

Crops in the oil complex. Sunflower, soybean, canola/rapeseed, sesame, groundnut, cottonseed and coconut/copra are bulk supply candidates. Avocado and macadamia are minor high-value oils and export chains: they matter for export earnings but are not treated as major volume substitutes for imported edible oil.

Implementation boundary. This report mirrors the methodology’s accounting and physical supply structure and makes the estimation boundary explicit. A fully estimated PE forecast still needs the KIHBS household microdata, KNBS supply-use coefficients, monthly world and domestic prices, county-year area, yield and price panels, crusher and refinery capacity, stocks and re-export and mirror trade series. Where those are missing, the report uses transparent calibrated assumptions rather than presenting estimated coefficients that do not exist.

Model results

Summary of the Base scenario

  • 9 of 10

    crops have Base domestic capacity at or above modelled 2035 demand

    For these crops the defined market, not land or yield, becomes the binding constraint under the assumed area and yield path. It does not make the production target certain.

  • 1.6%

    of Base 2035 palm-oil demand is covered domestically

    Base demand reaches about 1.04M t CPO-equivalent while domestic capacity reaches 16.5k t.

  • +71%

    Base macadamia demand growth, 2024–2035

    The fastest-growing Base demand path in the portfolio, driven by the 5% export-demand scenario.

  • 6

    crops carry an explicit maturity lag

    Perennial supply does not appear immediately after planting; each crop’s lag is listed under its projection below.

Modelling framework

Demand and domestic supply capacity are estimated separately

  1. Forecast demand

    Each crop uses a demand method suited to its market: import substitution, export growth, industrial capacity, or a domestic or export proxy.

  2. Build domestic capacity

    Area moves toward scenario targets, new perennial area waits until bearing age, and yield moves toward a potential yield.

  3. Convert to the market unit

    Seed is converted to oil, fresh fruit bunches to crude palm oil and seed cotton to lint, so supply and demand are compared in the same unit.

  4. Compare demand with local supply

    Local supply gap = max(demand − domestic supply capacity, 0). Imports are not counted as supply in this comparison.

Forecast explorer

Historical observations and the 2025–2035 scenario range

Observed years sit on white; the shaded zone is modelled, starting at the 2025 model year. The teal line is the Base path and the band spans the Low and High scenarios.

Sunflower: demand and domestic productionMT sunflower oil · observed to the latest year, modelled to 2035
ObservedModelled outlook010k20k30k40k50k201920202021202220232024202520302035
  • Demand
  • Domestic production
  • Low–High demand range

How to read this chart. Direct sunflower-oil imports are the comparable observed market series used as the model's minimum demand floor. Production is converted into the same unit as demand with the crop’s conversion factor. The local supply gap is demand minus Kenyan production; imports are not counted as supply.

Data behind this chart
YearDemandDomestic productionPeriod
20197,733.72—Observed
20206,703.36—Observed
20217,638.76—Observed
202212,742.07165.19Observed
20236,919.723,471.94Observed
20248,94914,120.5Observed
20259,217.4714,120.5Modelled
20268,898.7416,607.43Modelled
20279,180.6719,291.92Modelled
20289,502.8622,173.97Modelled
20299,836.3625,253.58Modelled
203010,181.5628,530.75Modelled
203110,532.6232,005.48Modelled
203210,895.7935,677.77Modelled
203311,271.4839,547.62Modelled
203411,660.1243,615.03Modelled
203512,062.1747,880Modelled

Observed: crop-specific AFA, KNBS, Tea Board, WITS and other series recorded in the workbook. Forecast: SAFIC crop model, Base scenario with Low and High sensitivity paths. Shading starts at the 2025 model year.

2035 Base demand
12.1k
MT sunflower oil
2035 domestic capacity
47.9k
MT sunflower oil
Capacity as share of demand
397%
100% = capacity equals demand
2035 demand range
8.8k–15k
Low to High scenario

Crop-specific projections

Forecast paths and assumptions by crop

The Low, Base and High demand paths for each crop, and the domestic supply-capacity assumptions used to judge whether those markets could be served from Kenyan production.

Sunflower

Import substitution — edible oil

2035 Low demand
8.8k
MT sunflower oil
2035 Base demand
12.1k
MT sunflower oil
2035 High demand
15k
MT sunflower oil
Base demand and domestic production capacityMT sunflower oil · 2025–2035
010k20k30k40k50k202520302035
  • Demand
  • Domestic production capacity

In 2035, domestic capacity equals 397% of Base demand. Binding constraint: Demand/market.

How demand is modelled

Multi-factor import-demand forecast anchored to direct sunflower-oil imports. Population and real per-capita income raise demand; higher import prices/FX pressure reduce it. Direct imports are treated as a minimum demand floor.

How supply is modelled

Planted area moves linearly toward scenario-specific 2035 targets; yield closes toward 2.0 t/ha in Base/High. Seed output is converted to oil using a 34.2% recovery factor.

Interpretation note

The addressable market is narrower than Kenya’s total edible-oil substitution opportunity.

Assumptions
Demand anchor2024: 8,949 MT sunflower oil
Demand methodExisting multi-factor import-demand series
Current area40,675 ha
Current raw yield1.02 t/ha
2035 area targetsLow 40,675 ha · Base 70,000 ha · High 120,000 ha
Area cap or envelope120,000 ha (Planning envelope; no national GIS suitability hectares found)
Potential yield2 t/ha
Conversion to demand unit34.2% (38% minimum oil content (AFA seed spec) × 90% analyst mill-recovery assumption)
Maturity lag0 years
Priority countiesSiaya, Homa Bay, Bungoma, Kakamega, Trans Nzoia, Nakuru, Uasin Gishu, Kitui, Makueni, Machakos, Meru, Lamu, Kilifi, Kwale, Taita Taveta
Evidence and source material

AFA calls sunflower widely adapted. Direct imports are only a demand floor; broader palm-oil substitution could make the addressable market much larger.

Scenario calculator

Test alternative assumptions

Change the demand and supply assumptions for a crop and compare your 2035 result with the published Base scenario, which stays fixed on the chart.

Sunflower demand method: Multi-factor import-demand forecast anchored to direct sunflower-oil imports. Population and real per-capita income raise demand; higher import prices/FX pressure reduce it. Direct imports are treated as a minimum demand floor.

Demand assumptions Existing multi-factor import-demand series

Starting point for the custom demand path.

UN-derived Base path.

UN-derived Base path.

AfDB Base input.

Held at 4.7% in the verified model.

Demand response to real per-capita income.

Negative values reduce demand when real prices rise.

Advanced demand drivers

Verified Base = 0 because no reliable coefficient was found.

Only matters if urbanisation elasticity is not zero.

Only matters if urbanisation elasticity is not zero.

Positive = shilling depreciation; negative = appreciation.

Nominal USD price assumption.

Nominal USD price assumption.

Verified Base holds this at zero.

Supply assumptions Area × yield × conversion, with maturity lag

Starting area. A reconciled PE model would estimate county-specific responses.

The long-run desired area that planted area moves toward.

Area is constrained by the available planning envelope.

Share of the gap to the long-run area closed each year (Nerlovian partial adjustment, calibrated).

Starting crop yield.

Potential-yield anchor for the adoption component.

Share of the target yield farms can reach (κ).

Annual yield trend before the adoption increment.

Midpoint of the logistic improved-practice adoption curve.

Steepness of the logistic adoption curve.

Seed or crop lost before crushing or conversion.

Varietal oil content (ω). Palm uses a fruit-to-oil factor in the extraction field.

Realised extraction efficiency (η), separate from oil content.

Refining loss (δ) after extraction.

For perennial oil crops, new area only becomes bearing after the lag.

Inputs are scenario assumptions. Values outside the evidence-backed range are allowed for sensitivity testing and do not become SAFIC forecasts.

My scenario

Sunflower: my 2035 scenario

Compared with the published Base scenario · MT sunflower oil

2035 demand
12.1k
Base: 12.1k
2035 domestic supply capacity
36.3k
Base: 47.9k
Demand met by domestic supply
100%
Capacity is 301% of demand
Surplus domestic capacity
24.2k
MT sunflower oil
ObservedModelled outlook010k20k30k40k50k2019202520302035
  • Observed demand
  • Base demand
  • Base supply
  • My demand
  • My supply

Under these assumptions, domestic capacity reaches 301% of 2035 demand. There is no local supply gap; surplus capacity is about 24.2k MT sunflower oil. Imports are not counted as supply.

How the calculation works

Edible-oil PE structure. The full methodology starts from the reconciled balance Qprod + Qimp − Qexp − Qre-exp ± ΔS = Ufood + Uproc + Uoleo + Uloss. Food-direct demand is specified with QUAIDS elasticities and a Gompertz saturation path; processing and oleochemical demand come from using-sector output. Those coefficients need household, supply-use and price datasets this report does not yet hold, so the calculator keeps the demand path as a transparent calibrated sensitivity layer rather than labelling it an estimated QUAIDS result.

Domestic oil supply follows the methodology’s physical identity: Qoil = area × yield × (1 − loss) × oil content × extraction efficiency × (1 − refining loss). Area approaches its long-run signal through partial adjustment; yield combines an autonomous trend with logistic technology adoption; perennial bearing area respects the maturity lag. A positive gap, max(demand − domestic oil supply, 0), is the residual import requirement within this calibrated layer.

Methodological notes

How to read these forecasts

  • Scenario, not certainty. Low, Base and High are conditional sensitivity paths, not P10/P50/P90 probability bands. The methodology requires backcasting and at least 10,000 Monte Carlo draws before probabilistic fan charts are reported.
  • Edible-oil supply follows the PE physical identity. Area, yield, post-harvest loss, oil content, extraction efficiency and refining loss are separate inputs in the calculator; full county-level Nerlovian estimation and crusher-capacity constraints need the external estimation dataset.
  • Demand is crop-specific. Sunflower and canola use direct oil imports as a narrow demand floor; cotton uses spinning capacity; coffee and tea use export-demand growth. Where imports help define the demand market, they are not counted as domestic supply when the local supply gap is calculated.
  • Land envelopes differ in evidence quality. Some are official cultivation envelopes; others are analyst or programme planning assumptions and should not be read as national suitability maps.
  • Perennial timing matters. New avocado, macadamia, cashew and palm area does not become productive straight away.

Data and reuse

Download the data

The full 2025–2035 Low, Base and High series with the input register behind the charts, and every observed series used in Part I.