Livestock contributes about 40% of agricultural GDP — but most of it never reaches a formal market.
Kenya's national herd is huge — 17M cattle, 53M sheep and goats, 52M poultry — and overwhelmingly held by pastoralists and smallholders rather than commercial operations. Dairy is the most monetised sub-sector. Beef, shoats and camel sit largely in informal channels. The result is a sector that delivers calories, livelihoods and cultural identity at scale, but that the macro statistics struggle to count.
Shoats outnumber cattle three to one.
The headline herd shape is dominated by sheep and goats — collectively "shoats" — at 53 million animals. Cattle come in at around 17M, of which roughly two-thirds are zebu and crosses kept by smallholders and pastoralists, the remaining third commercial dairy.
Poultry — at 52M birds — is overwhelmingly indigenous chicken kept on smallholder homesteads, with a growing commercial broiler/layer segment concentrated near Nairobi and the Lake region.
Kenya's national herd is enormous and almost entirely smallholder-owned, but it is not evenly composed, and the species mix shapes everything from rural diets to drought vulnerability. The figures count living animals by species, drawing on KNBS Statistical Abstract data and Ministry of Livestock census work; sheep and goats are conventionally grouped as "shoats" in pastoralist accounting, and poultry spans both backyard indigenous birds and commercial flocks.
The composition matters because different species play different economic and ecological roles. Cattle concentrate value and dairy potential in the wetter highlands; sheep and goats dominate the arid and semi-arid lands, where their drought tolerance and short reproductive cycles make them the workhorse of the pastoralist economy; poultry is the fastest-growing protein source and the most accessible entry point into livestock for poorer households.
The chart counts the national herd by species in millions of animals for 2024. Read the relative heights as a map of where livestock wealth and resilience sit across Kenya's very different landscapes — and which species the country actually depends on for protein and rural income.
Shoats outnumber cattle three to one.
Sheep and goats together (53M) form the largest single category in Kenya's national herd, ahead of poultry (52M) and well ahead of cattle (17M). Most of the sheep and goat population sits in arid and semi-arid lands.
Headline indicators
By county →Cattle & meat
Live exports →The total cattle population is one of the slowest-moving variables in Kenyan agriculture, and that stability is itself the point of the chart. Headcount has barely changed across more than a decade — but a flat line at the aggregate level conceals a quiet transformation happening underneath it.
The real change is compositional, not numerical. The breed mix is shifting from indigenous zebu toward improved dairy crossbreeds in the highlands, raising milk yield per animal even as total numbers stay constant; meanwhile disease-control infrastructure in the drylands is slowly improving the productivity and market value of the pastoralist herd. In other words, the herd is becoming more productive without becoming larger — an intensification story invisible to a simple headcount.
The chart plots cattle population from 2009 to 2024. The near-flat trend is the headline finding: read it not as stagnation but as evidence that Kenya's cattle gains are coming from quality and yield per head, not from putting more animals on the land.
Cattle headcount is essentially flat — quality is the story.
The national herd has hovered between 16.9M and 17.5M for over a decade. The change happening underneath is in breed mix and productivity per head — more crossbred dairy in the highlands, more disease-control infrastructure in the drylands.
What Kenyans eat in meat is a direct reflection of what the country's mix of highland and dryland landscapes can produce, and the composition is more revealing than the total tonnage. Beef and goat dominate by weight, a function of the large pastoralist herd and the cultural centrality of both; poultry, though smaller in absolute terms, is the fastest-growing category as commercial production expands around urban demand.
The mix matters for several reasons at once. It shapes the country's feed and water requirements, its vulnerability to drought, and the structure of the value chains that move animals from rangeland to plate. A shift toward poultry, where it occurs, is also a shift toward shorter, more industrialised and more weather-insulated supply chains.
The chart breaks national meat production into its species shares for 2023. Read the proportions as a statement about Kenya's protein economy: where it comes from today, and which segment is quietly reshaping it.
Beef is just under half of all meat consumed.
Beef makes up about 44% of Kenyan meat supply by weight. Goat (14%) and poultry (18%) are the next largest categories — and poultry is the fastest-growing in absolute terms.
Dairy — the most monetised sub-sector
Top dairy counties →Dairy is Kenya's most monetised livestock sub-sector and the only one with mature processing infrastructure linking large numbers of smallholder producers to urban consumers. That makes the milk production trend one of the clearest indicators of successful agricultural intensification in the country — it is a sector where investment in genetics, feed and cold chains translates fairly directly into output.
The upward trend over the past decade is driven less by more cows than by better ones: improved-breed dairy cattle, expanding artificial insemination, and the spread of cooling and collection infrastructure in peri-urban zones around Nairobi, Nakuru, Meru and Kiambu.
The chart plots national milk production in billion litres from 2014 to 2024. Read the steady climb as the dividend of breed improvement and cold-chain expansion — and as the strongest single example in the Atlas of livestock productivity gains compounding over time.
Milk is the growth story — up nearly 50% in a decade.
Production has risen from about 3.6B litres in 2014 to roughly 5.2B today. Better breed mix and cooler-chain expansion in peri-urban Nakuru, Meru and Kiambu are doing most of the work.
Milk production in Kenya is concentrated in the central highlands — counties with the cooler climate that improved dairy breeds need, the rainfall to support fodder, and crucially the proximity to the processing plants and urban markets that make commercial dairying viable.
This clustering has a clear implication: dairy development policy, cooperative strengthening and cold-chain investment deliver the most return when concentrated in and around these high-output counties, while extending the dairy economy into new areas requires building the collection and cooling infrastructure first.
The chart ranks counties by annual milk production in million litres for 2023. Read the concentration at the top as the spatial core of Kenya's dairy economy.
Five counties produce around 30% of national milk.
Nakuru leads at 410M litres, followed by Meru, Kiambu, Nyandarua and Bomet. The cluster sits squarely in the central highlands, where altitude, rainfall, and proximity to Nairobi processing align.
Roughly 30% of milk is processed formally, 50% sold raw through informal traders, and 20% retained on-farm for family consumption and calves. The formal share has been rising — slowly — as cooling chains expand into peri-urban dairy zones.
Poultry
Eggs & meat trade →Kenyan poultry is splitting into two increasingly distinct sub-sectors with very different economics, and tracking eggs and meat together is the clearest way to see both at once. Backyard indigenous birds remain the calorie-and-cash buffer for millions of rural households, while a commercial broiler-and-layer sector is expanding fast around urban demand, with industrial feed, controlled housing and tight production cycles.
The dual trend matters because poultry is the most accessible livestock enterprise in the country — low capital, short cycles, scalable from a few birds to a commercial unit — and therefore the most likely route by which poorer and younger Kenyans enter livestock production.
The chart pairs egg production and poultry meat from 2018 to 2024 on a dual axis. Read the two rising lines together as evidence of the fastest-industrialising segment of Kenyan livestock — and the one most insulated from drought.
Eggs and meat are both growing — and faster than cattle.
Eggs rose from 125M dozen in 2018 to 188M in 2024; meat rose from 29kt to 46kt over the same period. Commercial broiler/layer expansion near Nairobi and Lake Victoria is the engine.
Pastoralism
Roughly 80% of Kenya's land area is arid or semi-arid — home to most of the country's shoats and camel.
Pastoralist households in northern and eastern Kenya — Turkana, Marsabit, Wajir, Mandera, Garissa, Isiolo, Samburu, Tana River, Kajiado, Narok — keep the bulk of the country's small ruminants, alongside the only meaningful camel population.
Three GCC export corridors are now active for live shoats and beef. Off-take age has fallen from roughly 18 to 12 months over the past decade — a clean signal of market modernisation in a sector long dismissed as subsistence.
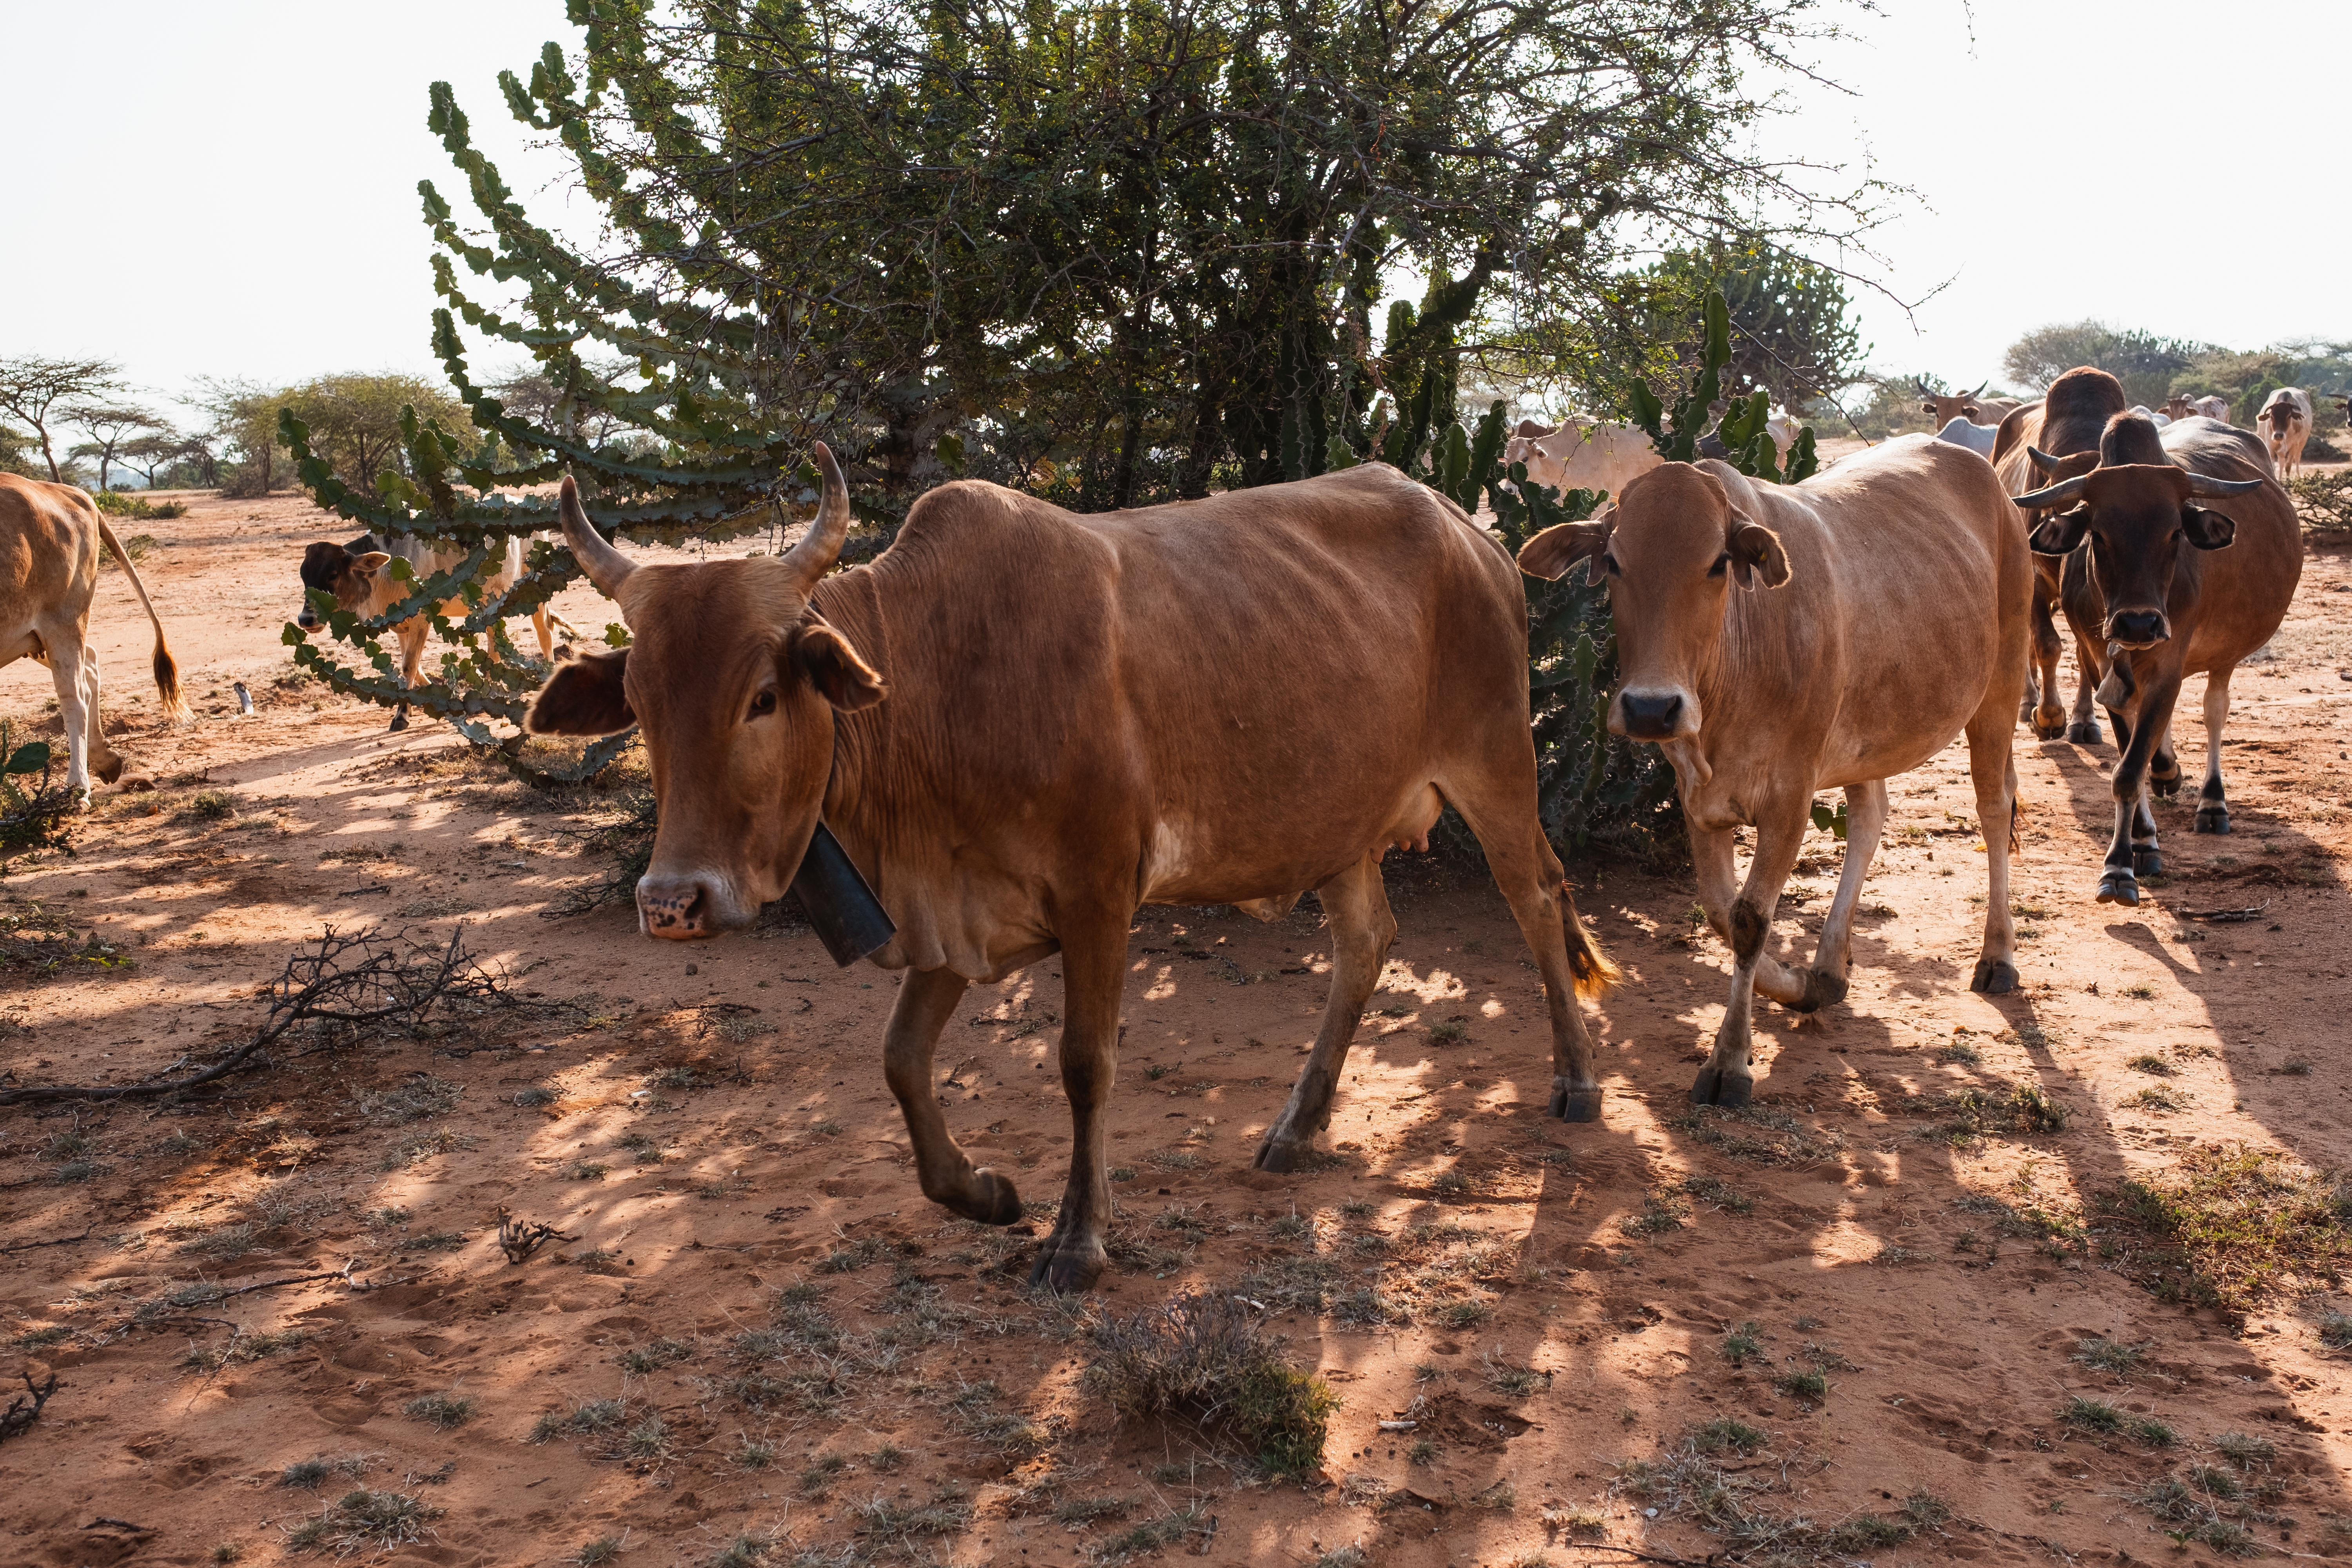
Roughly 80% of Kenya's land area is classified as arid or semi-arid — the ASAL counties — and although these lands are too dry for reliable cropping, they support a substantial livestock economy that is easy to overlook from a highland-centric viewpoint.
The species composition in the ASALs is shaped entirely by drought survival. Goats and sheep dominate because of their tolerance of sparse, variable forage and their short reproductive cycles; camels and hardy cattle breeds fill specific niches.
The chart counts the animals held in Kenya's ASAL counties in millions of head. Read the dominance of small stock as the rational core of the pastoralist economy.
Goats are the dominant ASAL species — by a long way.
Around 22M goats live in Kenya's arid and semi-arid lands, alongside 16M sheep, 7M cattle and the country's entire camel herd. Resilience to drought and short reproductive cycles make them the workhorse of the pastoralist economy.